Behind Every Survey: The story of SAHELI’s mapping and listing exercise
– By Roopashree S. Vadageri
Navigation has become an important part of our day-to-day lives. For example, a person who is new to an area can’t locate places without maps/landmarks/lanes/guidance from local people. Similarly, mapping and listing act as navigation tools and are the backbone of any survey that ensures accurate identification of sampling units and systematic coverage of the study population.
For me, as a qualitative researcher, the mapping and listing exercise, as well as a large-scale survey, was a very new experience. I realized that mapping and listing is not just about drawing roads or landmarks, it’s about replicating the locality on paper and accurately listing every structure and household in the sampled area. The exercise ensures that the final sample of participants is selected scientifically and without bias.
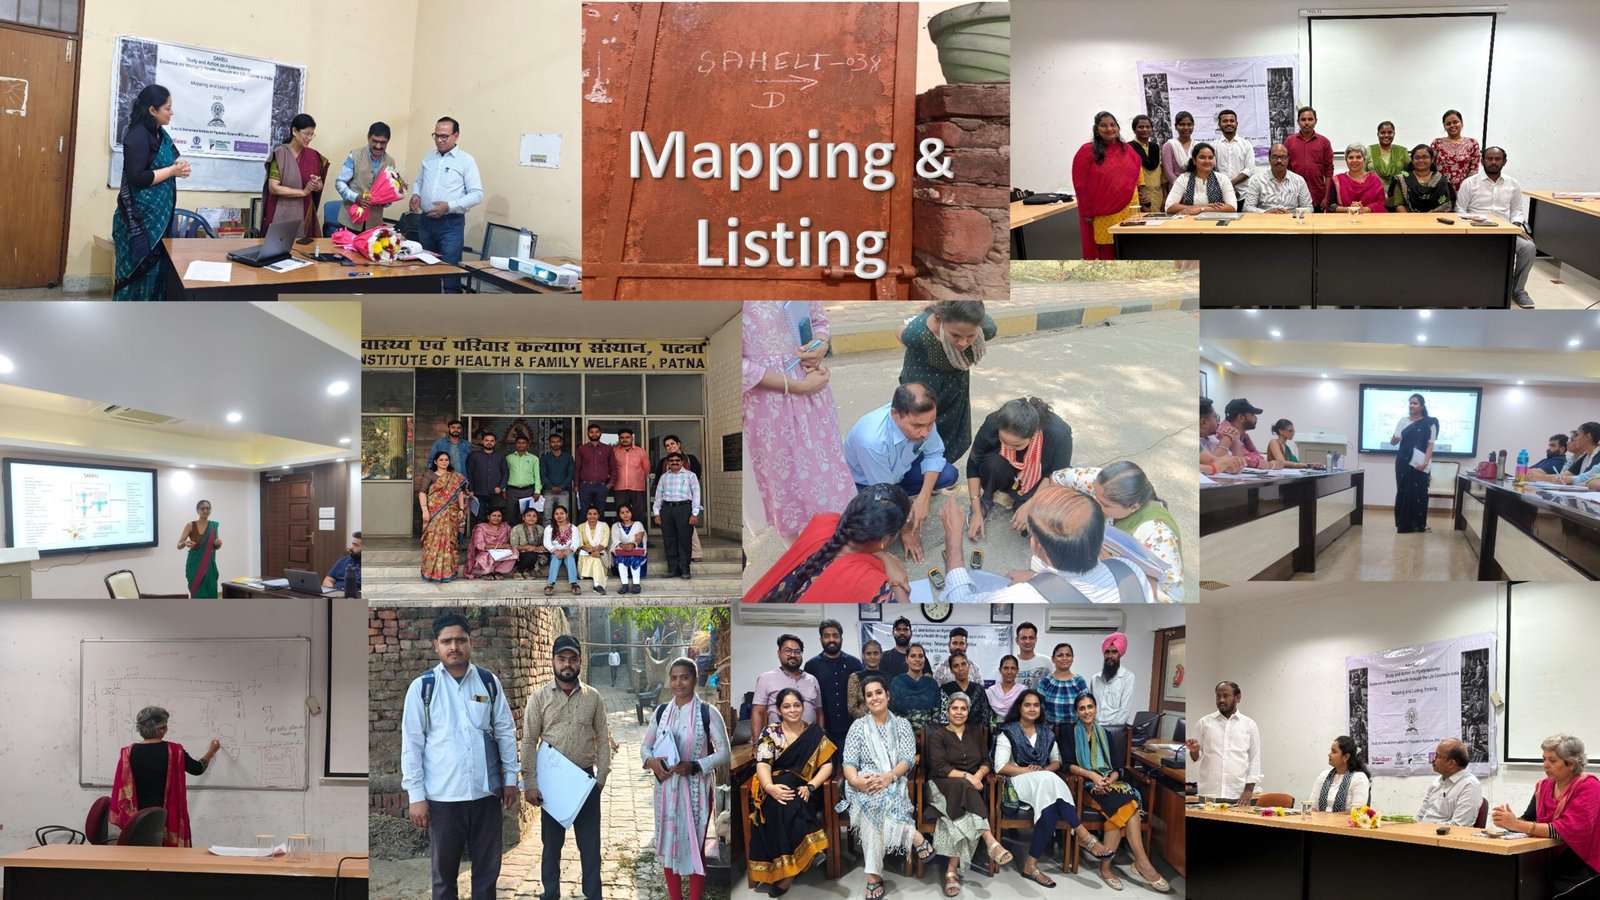
With all hopes and excitement, we launched the mapping and listing operation in our study states, i.e. Bihar, Telangana, and Punjab. We began with the state-level training for the recruited investigators. This training included a mix of theory and practice. Investigators were very curious to learn and understand the concepts specific to SAHELI, as every survey has its own specificity. Our investigators were experienced and had worked with other national surveys, which served as an added advantage in making the training more interactive through discussions and learning.
On the one hand, learning new concepts with prior experience can serve an advantage, but at times, this prior knowledge interfered with understanding the new concepts. Hence, during training, we had many discussions in the form of agreements and disagreements, ultimately reaching the consensus. However, at times, it was challenging to convince them because of their previous learning and practices, but we overcame this concern with active persuasion. Finally, we achieved a thorough understanding of the SAHELI protocol, which was slightly different from other surveys.
Along with the different mapping approaches, our listing procedure was relatively exhaustive, where we needed to identify the number of women in the age group 25-49 and the number of women with hysterectomy, with their names and ages in each household and the SSUs. We collected this information from households as well as with the help of ASHA workers. This detailed information made the mapping listing exercise very distinct from other large-scale surveys. Traditionally, the mapping and listing operation is done by a team of male mapper and lister, as the work is physically strenuous; the SAHELI household listing being women-centric, we recruited a male mapper and a female lister who could talk to women to collect information on hysterectomy.
This was my first experience in executing the mapping and listing operation, and I was managing the Telangana team. The mapping and listing operation in rural areas was relatively smooth, as identification of the boundary of a village was not a challenge – villages are the lowest administrative unit in rural India, with a population size of 1000 and SSU for SAHELI. A ward is the smallest geographical and administrative unit in urban India, yet its population size is relatively much larger than that of a village. Hence, the Census of India has artificially divided the large population of the ward into smaller and manageable geographical units popularly named as Census Enumeration Blocks (CEBs), for its operations. Hence, in urban areas, CEBs from the census are generally used for mapping and listing. As CEBs can only be identified with the help of maps generated by the census, we approached the census office in the respective states to obtain the CEB maps of 2011 census as a standard protocol. This document served as our primary reference before our teams ever set foot on the ground. We were supposed to identify the boundaries of urban SSUs based on these maps. The census was conducted way back in 2011, and the entire geographic of the selected SSUs has changed since then. Identifying the boundaries of each SSU, especially in a metropolitan city like Hyderabad, became a tedious task. Especially, when the urbanization rate was high in Telangana, i.e. 49%, and half of our sampling units (SSUs) were from urban areas, the identification of CEBs became a herculean task. Additionally, we faced the challenge in identifying the wards themselves, as some of the ward numbers changed primarily due to “delimitation”: the process of redrawing electoral and administrative boundaries to account for population shifts, urbanization, and changing civic needs.
Nowadays, large-scale surveys such as the National Family Health Survey (NFHS) and the Global Adult Tobacco Survey (GATS) (which consider the district as the Primary Sampling Unit (PSU)) use Urban Frame Survey (UFS) blocks (maps) as SSUs. These UFS blocks, developed by the National Sample Survey Office (NSSO) in a similar manner to CEBs, divide a district into small artificial units (without considering ward boundaries) for electoral and municipal administration purposes. Every five years the UFS maps are updated to capture recent changes. These units cannot be bifurcated for sub-districts. The PSU in SAHELI is the sub-district, while wards are considered as SSU, and further CEBs are the tertiary sampling units (TSU). Hence, we could not use the UFS maps for our survey.
The field teams began exploring the selected study areas to familiarize themselves with local geography and administrative boundaries. Hereafter, our real struggle began.
Landscape changed, and landmarks mattered. We were so surprised to see the two extreme ends of the quality of maps during the state operation. A few maps were really masterpieces – well-drawn, with crisp lines, and layouts that included proper landmarks and accurate directions, as they were easy to read and navigate. But the real mysteries started to unfold when we saw other maps which were filled with many errors, and turned out to be were very difficult to read and trace the location. Imagine maps featuring “one circle with four roads,” no landmarks, no street names, and no directions, and we all know, cities will have hundreds of such circles, each with four connecting roads. Trying to identify the correct location was a bit challenging. Also, I remember that in one of the maps, only the railway track was drawn, with two roads running alongside; such an area was very difficult to be located by using such maps. Without those vital details, it’s like you are solving a riddle to reach your destination. We were confused and lost at the same time, unsure whether to be happy and start with the easy-to-trace areas or the tough ones.
We followed different strategies, such as observing locations within the wards. We walked almost the whole day to identify such a location (marked on the map), however ended up with multiple similar locations in the same ward. For me, this was the most challenging part of the entire mapping and listing operation. Along with self-exploration, we approached local people to enquire about the area, especially community leaders and long-time residents, as they have witnessed all the changes and developments that have taken place in the past years. With their help, we were able to identify/trace the CEB within the ward. After a long struggle of searching for and confirming the correct location, we conducted a community walk to determine the boundaries of that CEB. Later, following the left-hand rule (as per the mapping and listing manual), we began marking all structures (both residential and non-residential) and collecting information for each marked household. An innovation of our mapping and listing was that our listing exercise was very extensive and collected extensive information, which provided the basis for the main survey. We also ensured that every household was informed about our main survey, which has helped us build strong relationships and rapport with the women and community members for future visits during the survey. Finally, we worked smoothly in the field without any disruptions.
Overall, the mapping and listing exercise required a high level of coordination, persistence, and methodological rigour. The systematic approach adopted by the field teams ensured the accurate identification of enumeration areas and laid a strong foundation for high-quality survey implementation.
Though the mapping and listing exercise is an obvious component of large-scale surveys, it has never been talked about. But for me, this was the foundation stone and a new learning experience in my career in the field of survey research.